

This Land is Their Land: Birds on Public Lands from the State of the Birds Report
July 15, 2011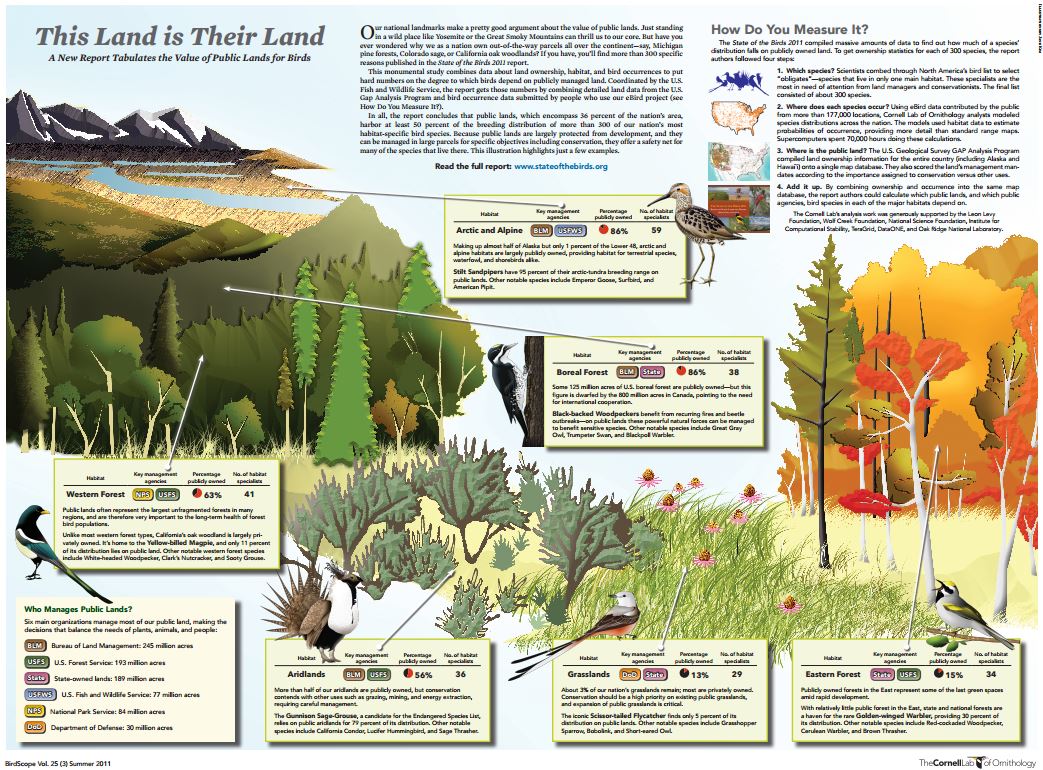

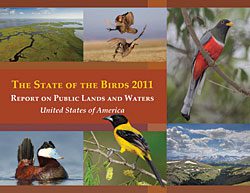
Our national landmarks make a pretty good argument about the value of public lands. Just standing in a wild place like Yosemite or the Great Smoky Mountains can thrill us to our core. But have you ever wondered why we as a nation own out-of-the-way parcels all over the continent—say, Michigan pine forests, Colorado sage, or California oak woodlands? If you have, you’ll find more than 300 specific reasons published in the State of the Birds 2011 report.
This monumental study combines data about land ownership, habitat, and bird occurrences to put hard numbers on the degree to which birds depend on publicly managed land. Coordinated by the U.S. Fish and Wildlife Service, the report gets those numbers by combining detailed land data from the U.S. Gap Analysis Program and bird occurrence data submitted by people who use our eBird project (see How Do You Measure It?). In all, the report concludes that public lands, which encompass 36 percent of the nation’s area, harbor at least 50 percent of the breeding distribution of more than 300 of our nation’s most habitat-specific bird species. Because public lands are largely protected from development, and they can be managed in large parcels for specific objectives including conservation, they offer a safety net for many of the species that live there. This illustration highlights just a few examples. Read the full report: www.stateofthebirds.org
How Do You Measure It?
The State of the Birds 2011 compiled massive amounts of data to find out how much of a species’ distribution falls on publicly owned land. To get ownership statistics for each of 300 species, the report authors followed four steps:

1. Which species? Scientists combed through North America’s bird list to select “obligates”—species that live in only one main habitat. These specialists are the most in need of attention from land managers and conservationists. The final list consisted of about 300 species.
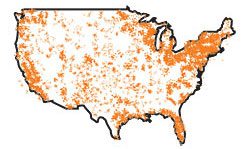
2. Where does each species occur? Using eBird data contributed by the public from more than 177,000 locations, Cornell Lab of Ornithology analysts modeled species distributions across the nation. The models used habitat data to estimate probabilities of occurrence, providing more detail than standard range maps. Supercomputers spent 70,000 hours doing these calculations.
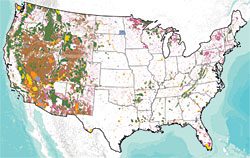
3. Where is the public land? The U.S. Geological Survey GAP Analysis Program compiled land ownership information for the entire country (including Alaska and Hawai`i) onto a single map database. They also scored the land’s management mandates according to the importance assigned to conservation versus other uses.
4. Add it up. By combining ownership and occurrence into the same map database, the report authors could calculate which public lands, and which public agencies, bird species in each of the major habitats depend on.

The Cornell Lab’s analysis work was generously supported by the Leon Levy Foundation, Wolf Creek Foundation, National Science Foundation, Institute for Computational Stability, TeraGrid, DataONE, and Oak Ridge National Laboratory.
Originally published in the Summer 2011 issue of BirdScope.
All About Birds
is a free resource
Available for everyone,
funded by donors like you
American Kestrel by Blair Dudeck / Macaulay Library