
The recent 2022 State of the World’s Birds and U.S. State of the Birds reports paint a concerning picture of bird populations, with nearly half of the world’s bird species in decline. But where exactly are these losses occurring and during which times of the year? A new, game-changing conservation tool from the Cornell Lab of Ornithology helps to answer that question in unprecedented detail, and eBirders help make this groundbreaking tool a reality.
eBird Trends maps provide localized insights needed by those working to restore rapidly declining bird populations and habitats. “You can’t solve what you can’t see,” said Daniel Fink, senior research associate and science lead of the eBird Status and Trends project. “We’ve never been able to see population change with this level of detail across continental extents for so many species. With so many bird species in decline, the insights gained from eBird Trends are sorely needed!”
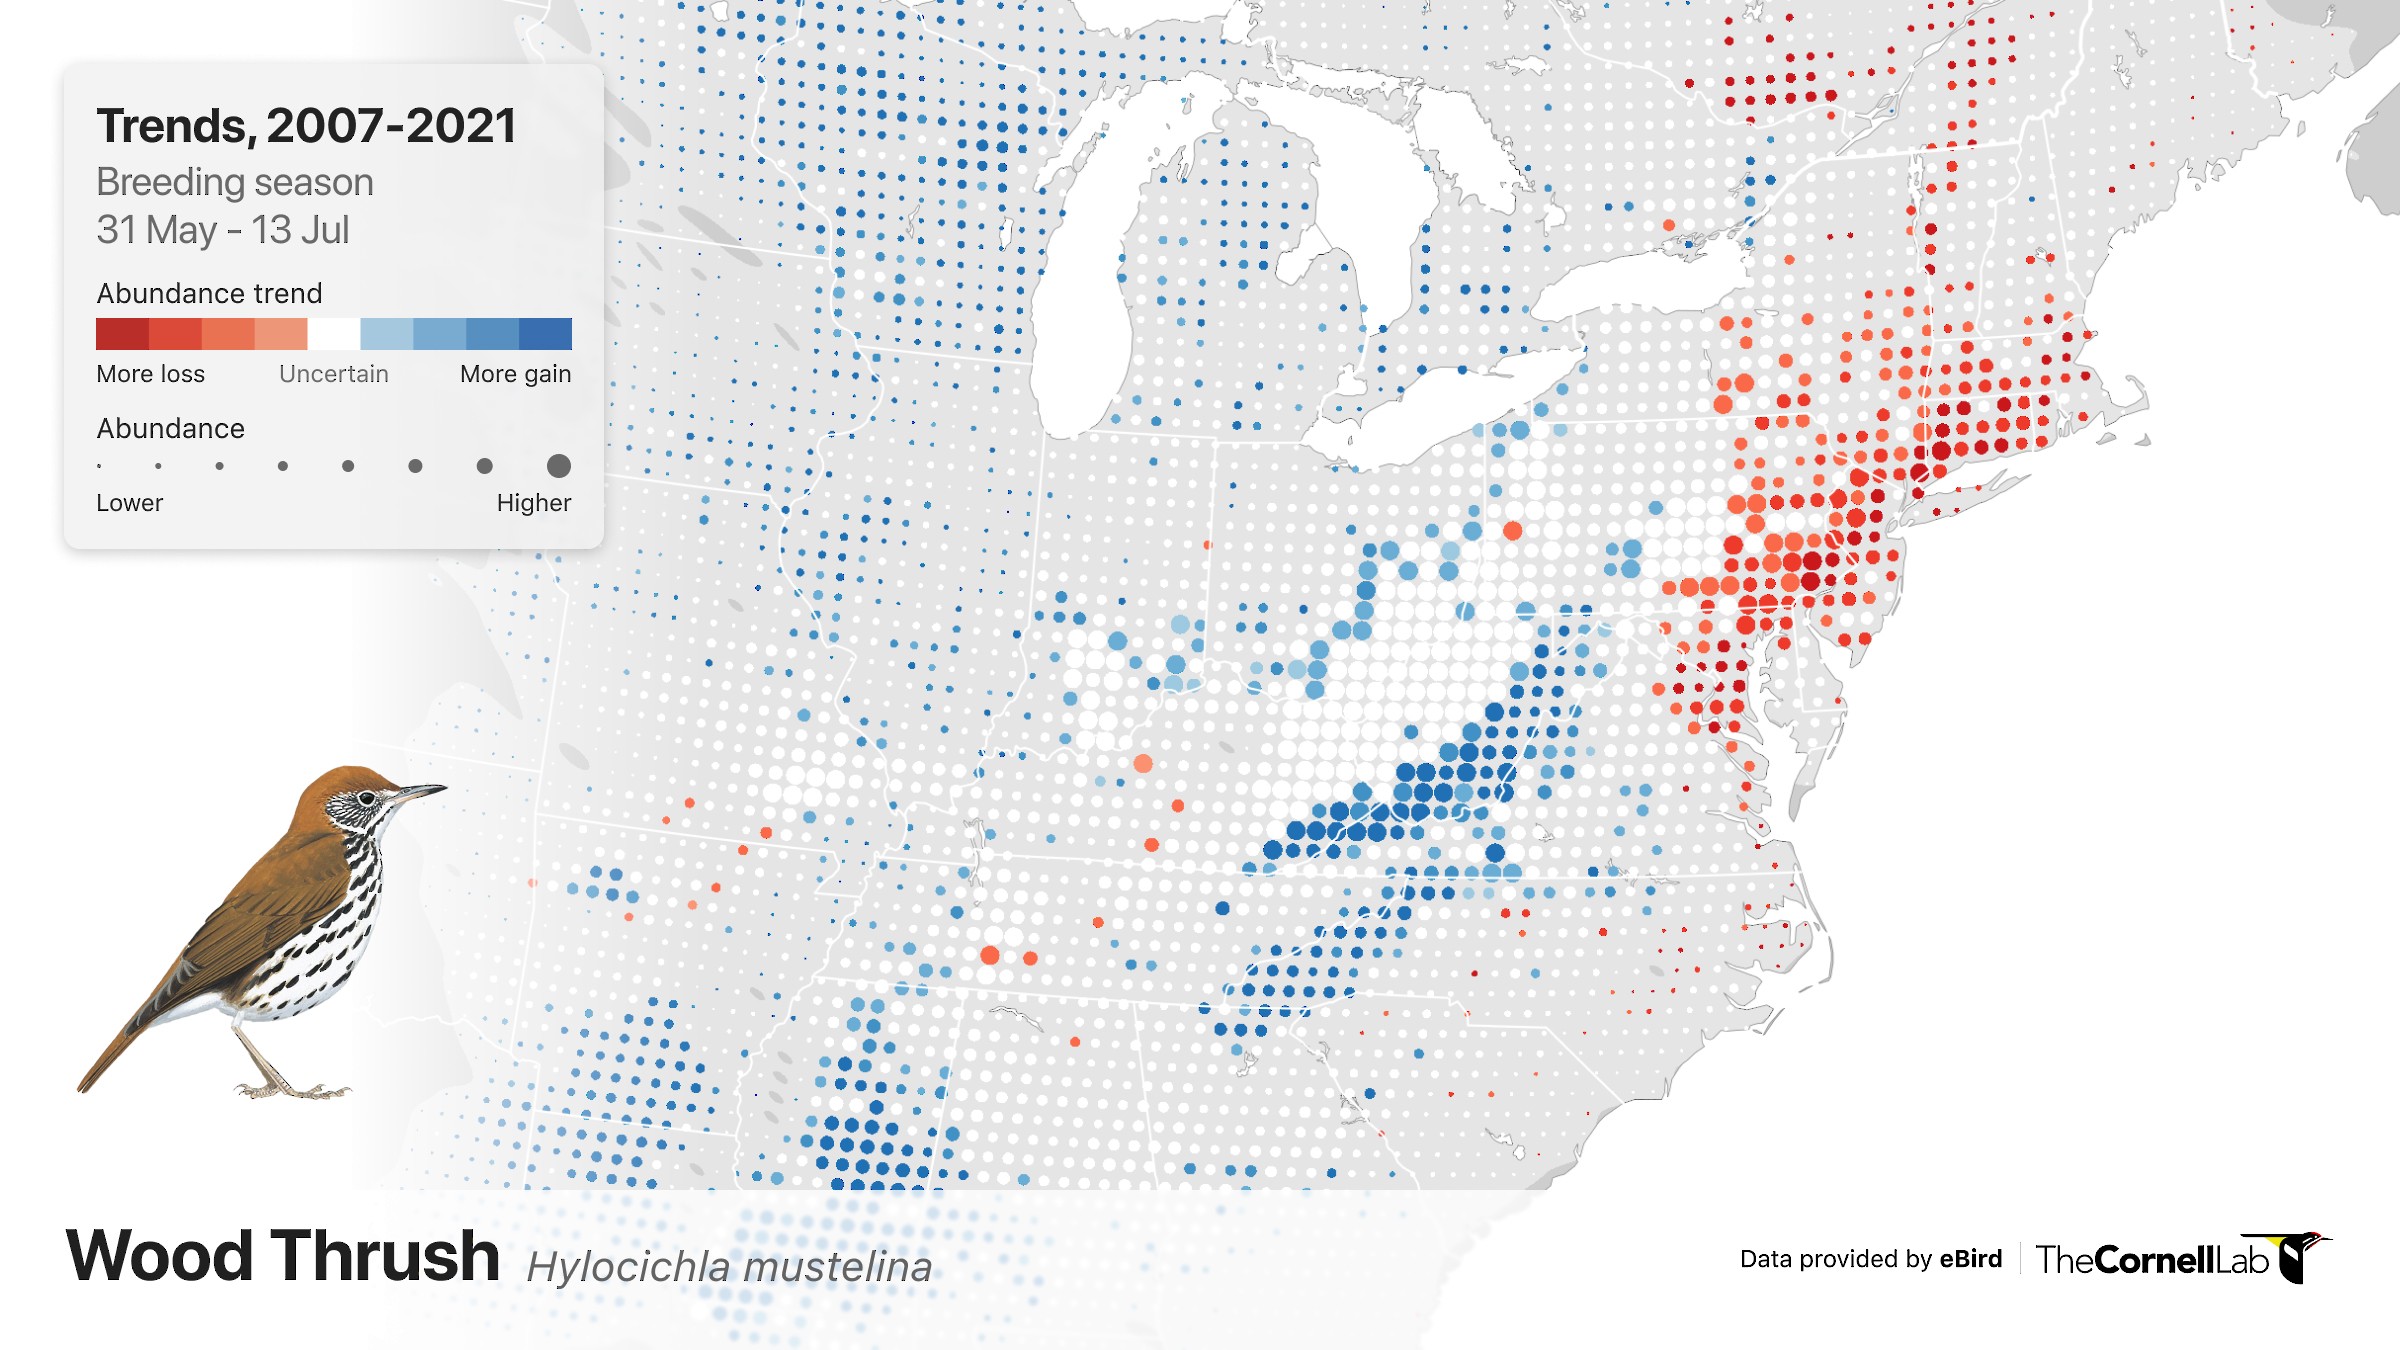
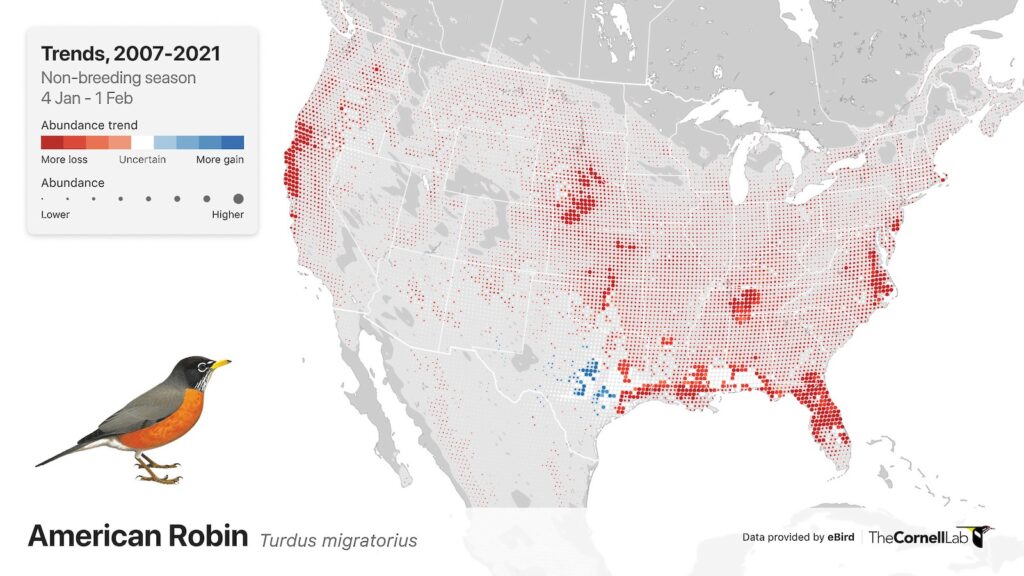
The new eBird Trends maps show precisely where and how bird populations are changing, using observations submitted by eBirders. For the first time, you’ll be able to zoom in and see where populations of more than 550 species are increasing or decreasing within an 8 mile radius. Identifying where on the landscape birds are doing well or in decline is the crucial first step to begin identifying ways to reverse pervasive losses like the ones identified by the 2022 U.S. State of the Birds report and the State of the World’s Birds.
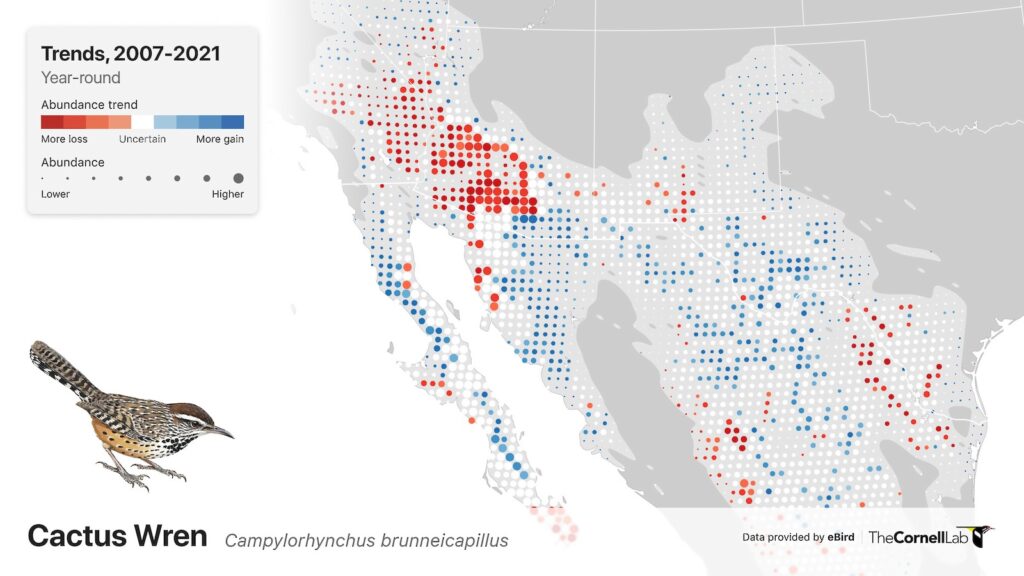
eBird Trends present a more comprehensive snapshot of population health by allowing us to visualize changes in abundance at local scales. A species may be doing fine in one area, while just over the next hill others of the same species are struggling and declining. eBird Trends maps pinpoint areas with the steepest population declines, allowing conservation groups to identify where focus and funding will do the greatest good.
eBird Trends maps also show changes in bird abundance during different parts of a bird’s annual cycle—a critical component that until now has been missing. Seeing how bird abundance changes during different times of the year can help scientists untangle how factors on the breeding or nonbreeding grounds could affect a species.
Trends maps for more than 550 species are currently available, mostly for the United States and Canada, where the necessary data exists. Your eBirding can help that number to keep growing. As more eBird data comes in from more locations, eBird data scientists will be able to predict status and trends for additional species around the globe.
“We’ll be adding additional functions to eBird Trends moving forward,” said Lab geospatial data science lead Tom Auer. “It’s a credit to all eBirders that we were able to create this level of localization, to make a daunting environmental issue something that individuals can influence simply by reporting their backyard birds.”
Explore eBird Trends and learn how your favorite birds are faring right where you live: https://science.ebird.org/en/status-and-trends/species?product=trends