

eBird Trends: Introducing the Ultimate Drill-Down Tool for Viewing Local Changes in Bird Populations
December 22, 2022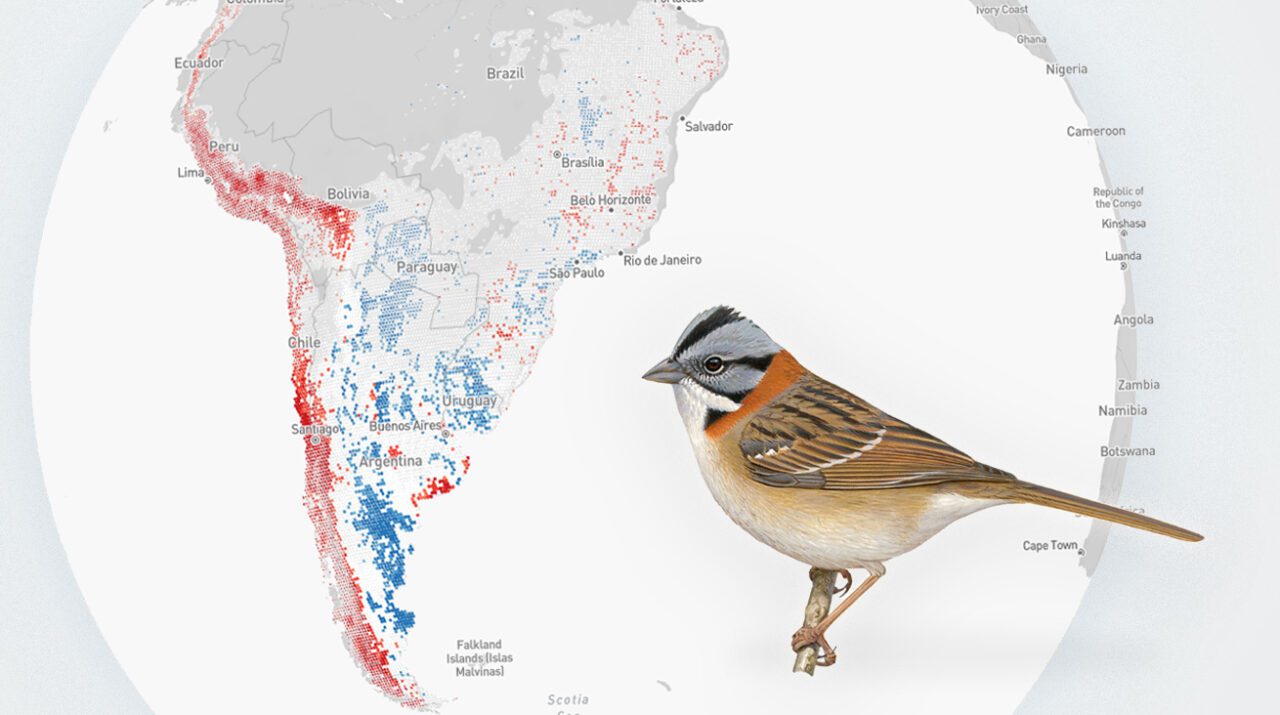


From the Winter 2023 issue of Living Bird magazine. Subscribe now.
A new generation of eBird Trends maps, released in November 2022, provides an unprecedented fine-scale view of where bird species are increasing or decreasing. The maps of population trends for more than 500 bird species are derived from big-data models produced by computer scientists at the Cornell Lab of Ornithology, using the more than 70 million bird-observation checklists submitted by citizen scientists to the Cornell Lab’s eBird program.
The eBird Trends maps depict exactly where bird population declines or increases are happening at scales as small as 27 x 27 km (16.7 x 16.7 miles), an area smaller than many counties. The maps can be used to guide research that examines the drivers of declines for birds in trouble, or to identify where conservation programs appear to be working and could be replicated elsewhere. eBird Trends maps also show changes in bird abundance during different phases of a bird’s life cycle and at different times of year, so scientists can untangle how factors on the breeding or nonbreeding grounds are affecting a species.
“Knowledge is power,” says Amanda Rodewald, Garvin professor and senior director of the Center for Avian Population Studies at the Cornell Lab. “By serving as an early warning system for declines, eBird Trends gives us more opportunity and flexibility to protect species before they become candidates for the Endangered Species list.”
A Sampling of Species Maps From the New eBird Trends Release
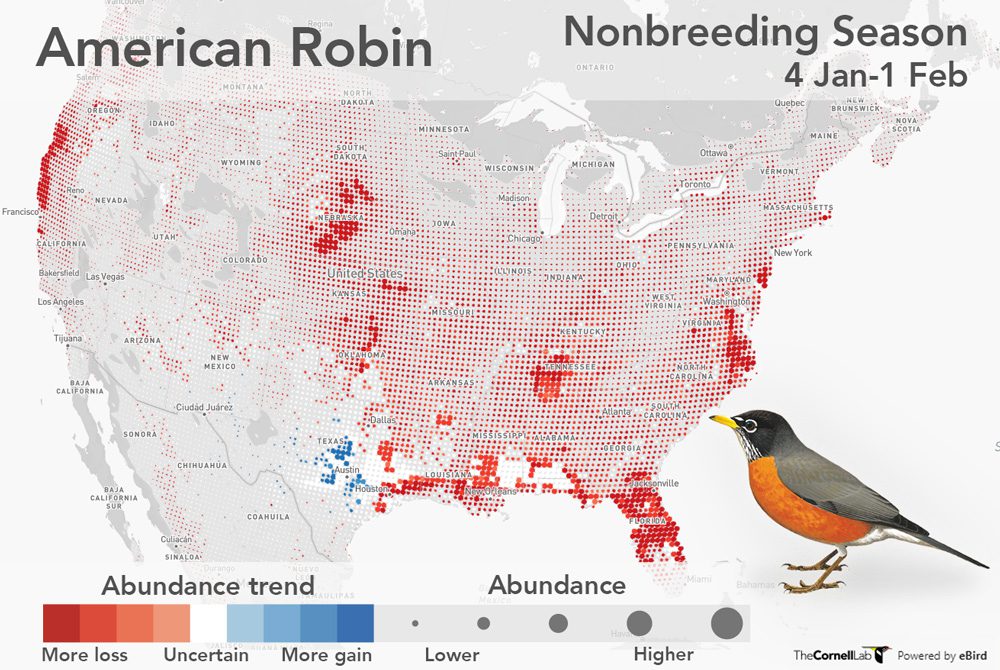
American Robins are considered a ubiquitous harbinger of spring, but the eBird Trends map for this species tells a different story of declining abundance, especially in winter. The large swaths of red are shocking for a species like American Robin that seems to be everywhere. It’s very difficult for people to notice changes in abundance in real time, especially if the changes are occurring slowly year after year. Slow declines add up, and the eBird Trends maps are a wake-up call for the need to study robin populations, especially in the darkest red areas.
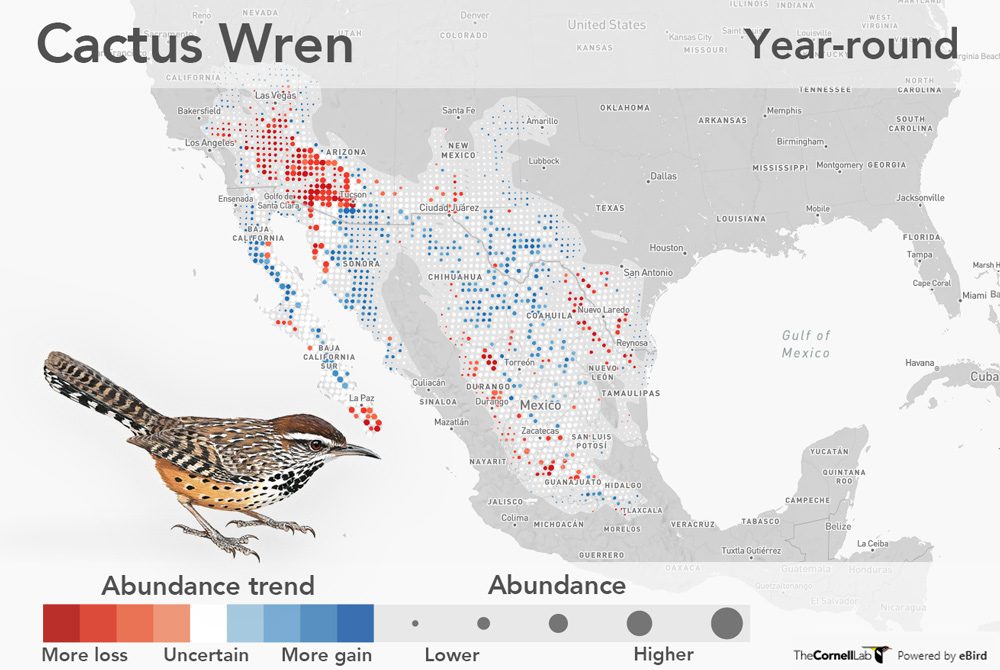
Cactus Wrens live in the desert Southwest, where the effects of extreme temperature, wildfire, rainfall, and expanding urban environments vary across the landscape. The eBird Trends map for Cactus Wren shows how local populations decrease and increase with respect to the presence or absence of these stressors. Red circles (declines) show up in the Mojave region. Extreme temperatures due to climate change could be a culprit: Scientists at the University of California found that birds in the Mojave Desert are declining due to decreased precipitation and elevated temperatures due to climate change.
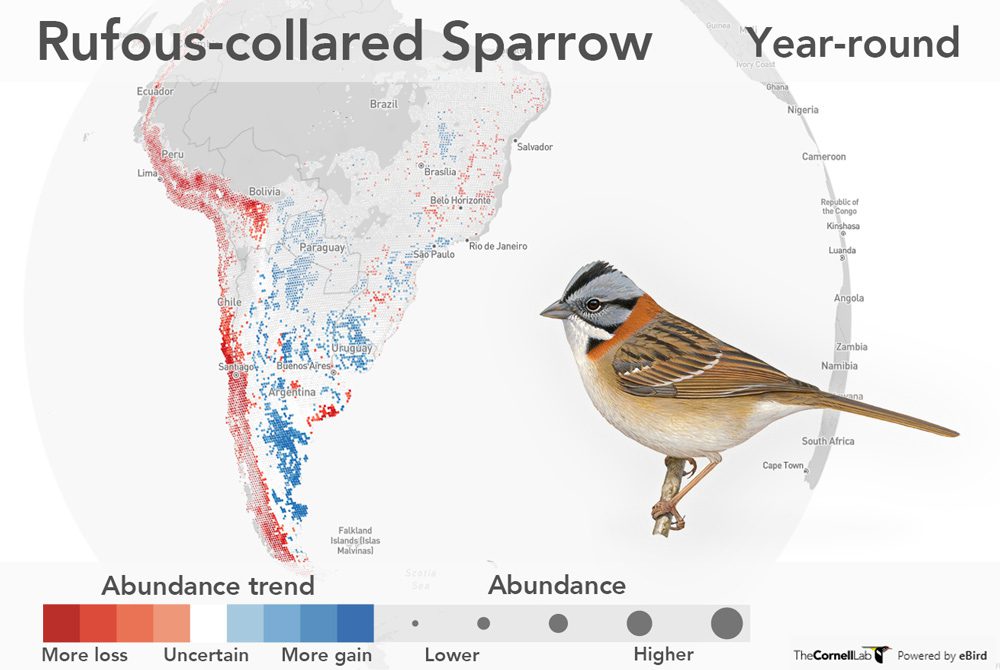
Rufous-collared Sparrow has an enormous range and eBird data covers most, but not all, of its range from southern Mexico through Central America to the tip of South America. In the Andes region, sufficient eBird data allowed for eBird Trends analysis that depicts numerous red circles, indicating a declining trend. Farther south in the range of the Rufous-collared Sparrow, light gray shading indicates areas where there was not enough data to reliably produce trend estimates. Model uncertainty stems from a variety of factors, including that additional eBird observations are needed.
All About Birds
is a free resource
Available for everyone,
funded by donors like you
American Kestrel by Blair Dudeck / Macaulay Library